Summary: This essay analyzes 45 years of US budget data from the Bureau of Fiscal Service (late 1980 to June 2025), investigating a headlines-worthy June 2025 budget surplus. Using inflation-adjusted figures and the Consumer Price Index as a deflator, the author discovers that monthly surpluses are predictable and driven by tax collection timing rather than representing policy anomalies. Government spending has increased 3.5 times in real terms since 1980 despite no proportional increase in observable services, leading the author to speculate that large transfer payments account for the spending growth. Current deficit patterns and government spending remain consistent with historical trends.
This week I will be taking a break from dot maps—have no fear, they will return—and instead am looking at data from The Bureau of Fiscal Service, specifically their Monthly Treasury Statement: These reports contain outlays and receipts for the period between late 1980 and June 2025.
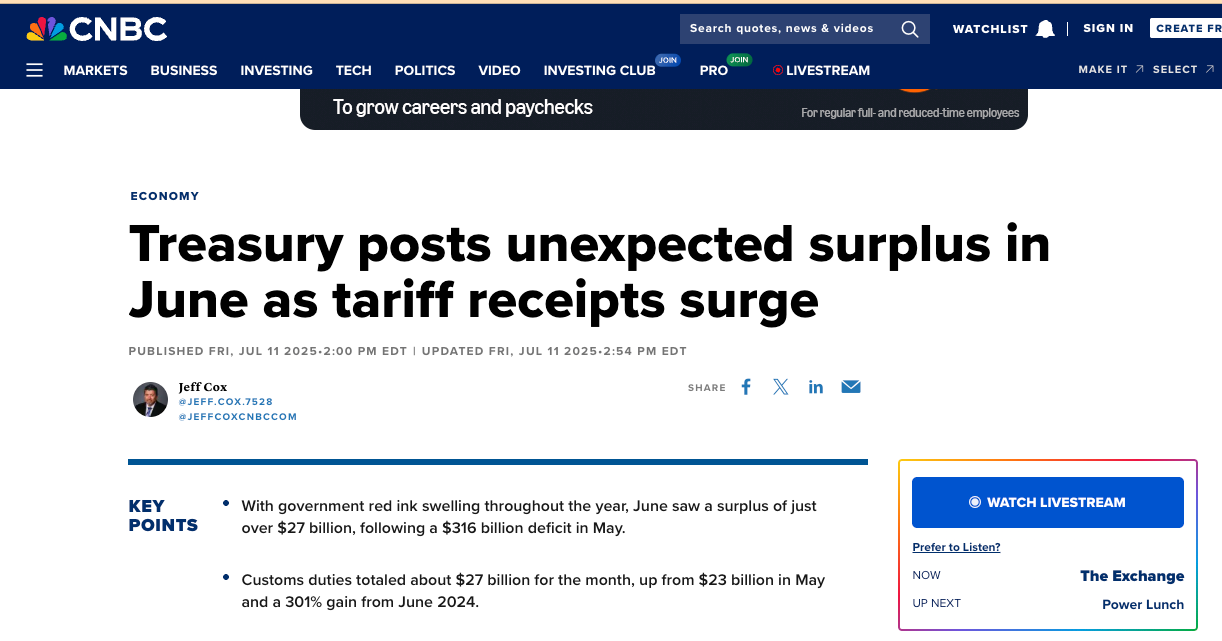
What originally drew me to this data were headlines a couple of weeks ago claiming America had posted a budget surplus for the month of June.
When I went to confirm this (to me, surprising) fact, I discovered this very neat dataset. So here are some graphics that came about from me playing around with the data!
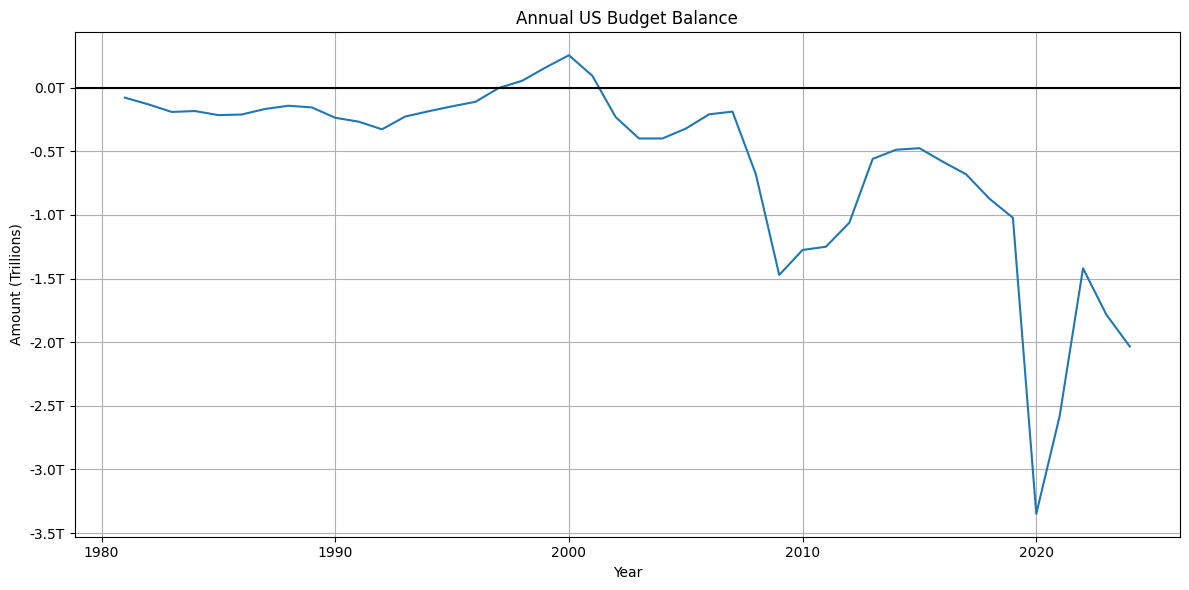
First off, here is the annual deficit.
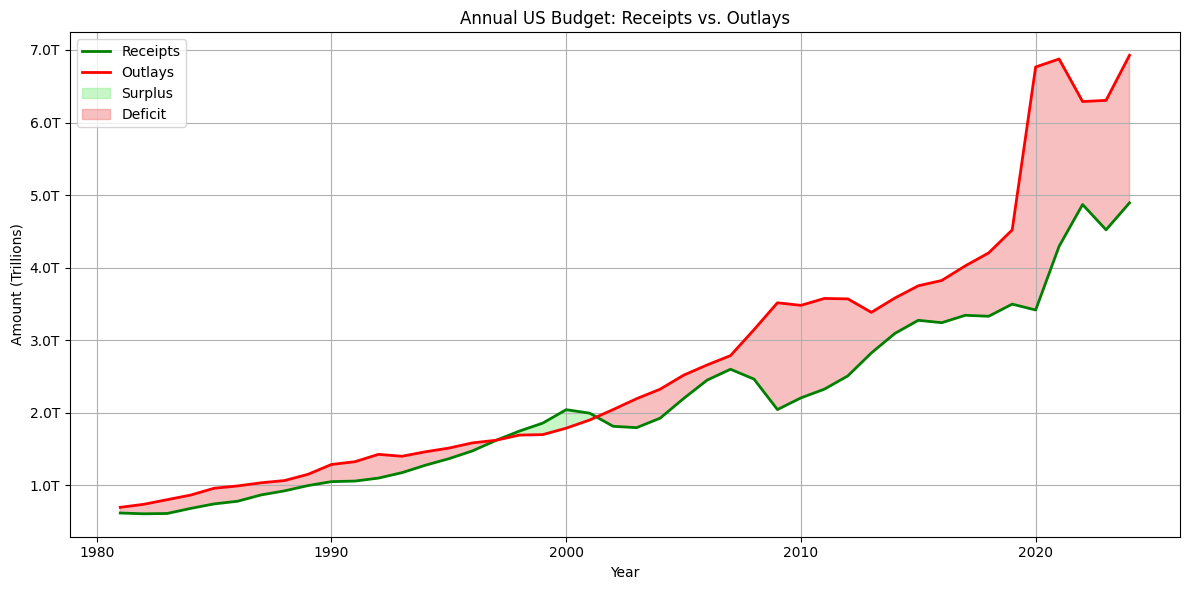
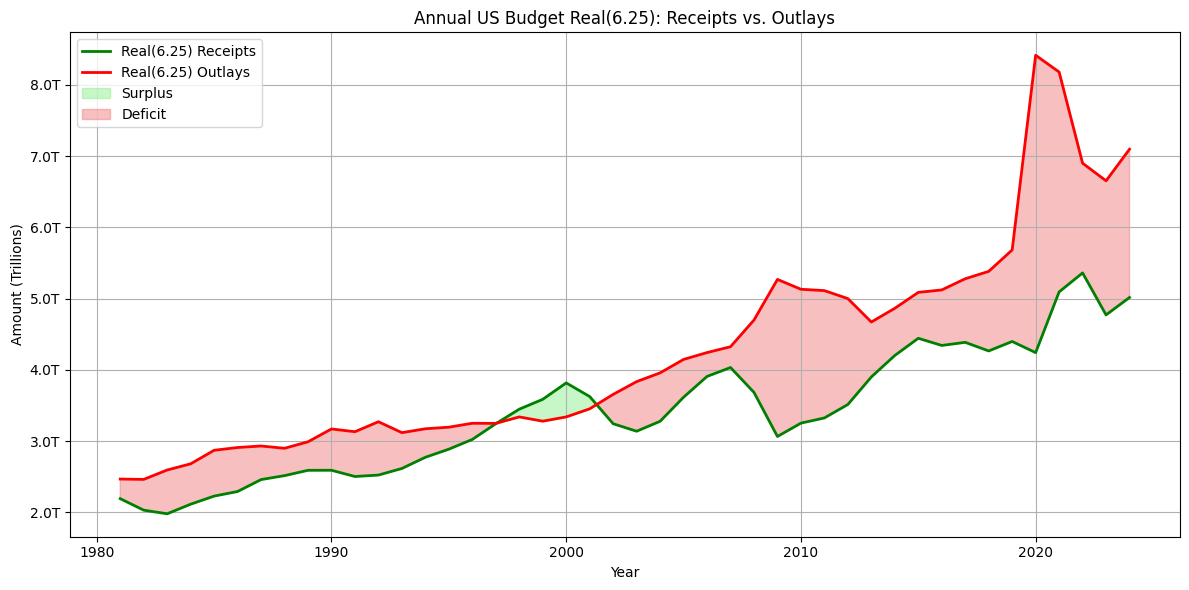
Here are the receipts and outlays.
As you can see, there was a brief period of time in the late 1990s and early 2000s where America had a surplus. Visually, it appears we mostly lost this surplus due to declining revenue—perhaps from tax cuts, perhaps from the 2000 crash.
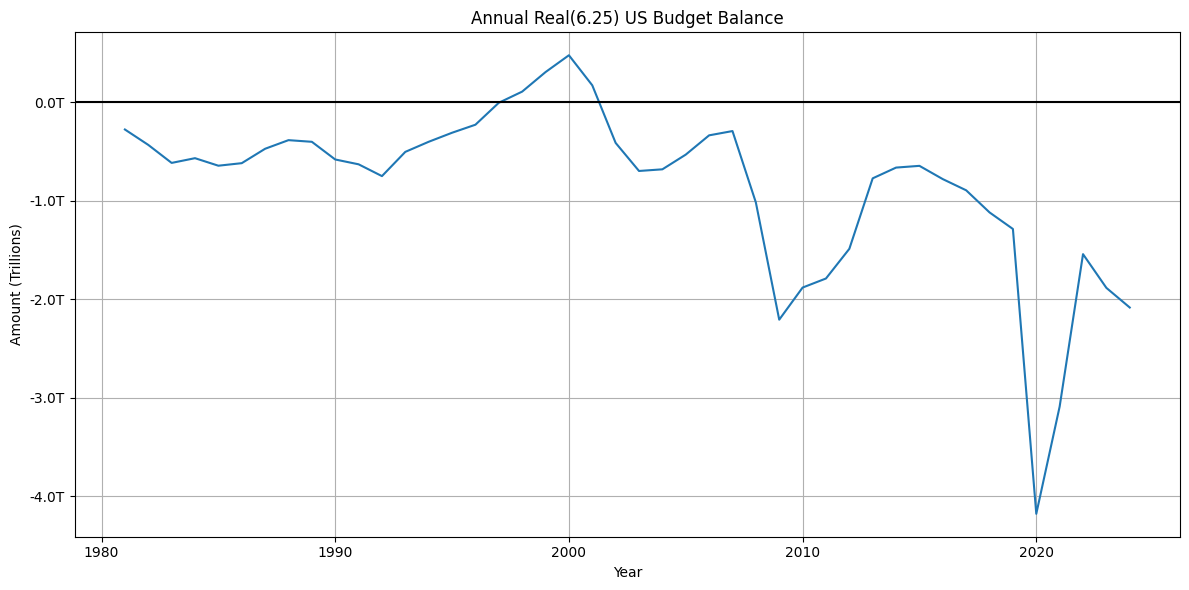
Everything so far is in nominal terms which can give a false impression about the true scale of the deficit over time. The correct response to this is to try and “deflate” the numbers to some base year. In order to do this, I used the “Consumer Price Index for All Urban Consumers: All Items in U.S. City Average” from FRED. I’ve adjusted all of the values so they are now in June 2025 terms.
If this is the wrong deflator, I’d love to be corrected, so let me know in the comments and I can update the graphics.
Everything is much the same, although prior deficits now look comparatively larger.
It is interesting that in real terms, our government spends ~3.5 times as much money as it did in 1980. Now, I did not live during that period, but it doesn’t seem like we get 3.5× the services. Even just between 2005 and 2025—a period of time I know well—real government spending has almost doubled. I would like to understand why the real spending doesn’t seem to map to ‘real’ services, and I suspect the explanation is we spend an enormous amount on transfer payments to people who are not 27-year-olds.
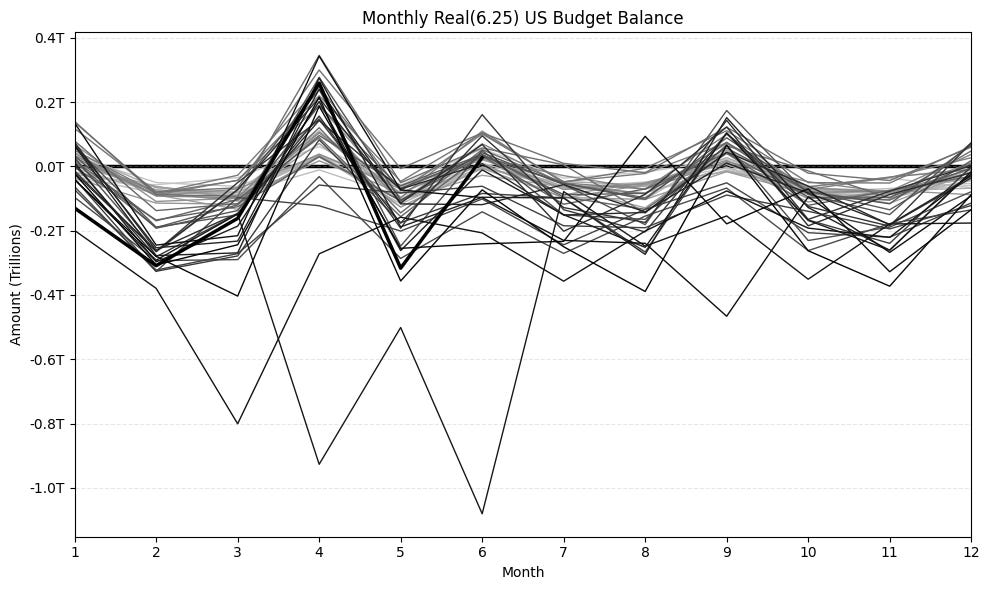
What had originally interested me in this data was how our budget changed throughout the year. A surplus in June could be very unusual, as some headlines implied, or just something that happens sometimes. So, sticking to the June 2025 dollars, I thought I would graph the monthly deficit for each year. The darker the line, the closer to 2025 it is. Open to suggestions on how to make this graphic better!
As you can see, we tend to have a monthly surplus mostly in April (when taxes are due) and then in June and September. I assume quarterly estimated tax payments are the main driver of this. That means if we were going to have a surplus, having one in June isn’t particularly shocking.
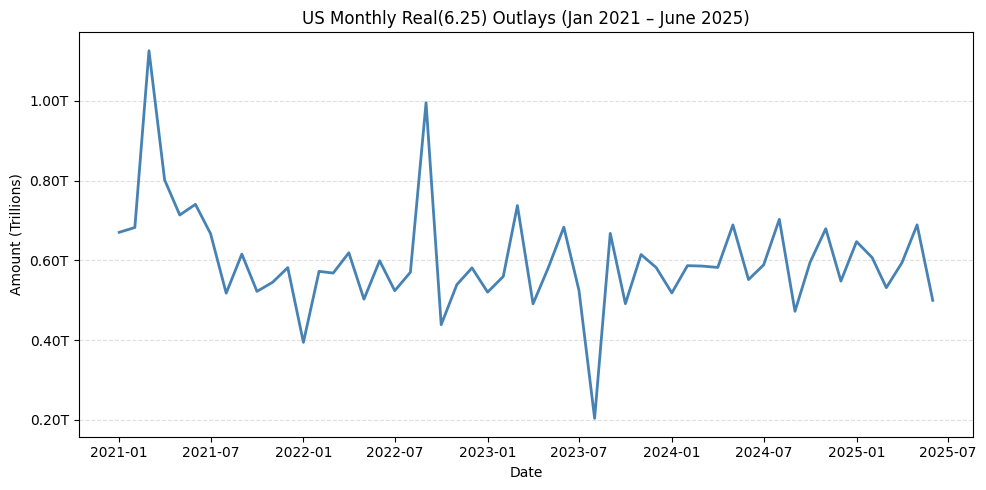
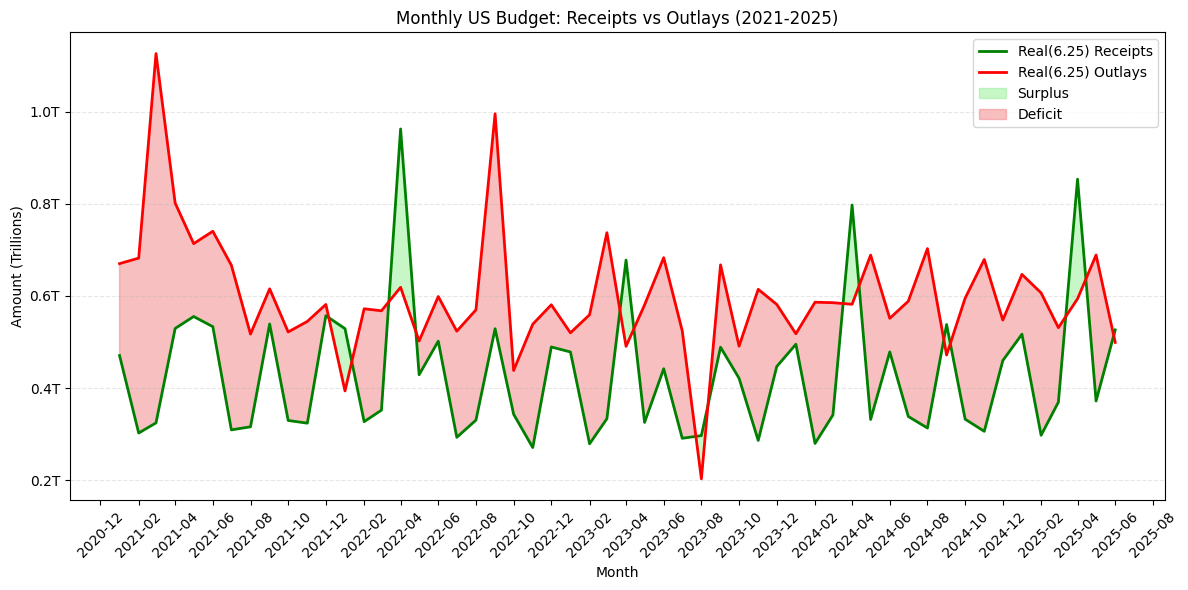
How much of this is the result of DoGE spending cuts, though? For this, I’ll continue to stick to the 2025-adjusted dollars.
Government spending doesn’t seem to be altered at all from the baseline.
Similarly, the deficit continues to look basically normal.
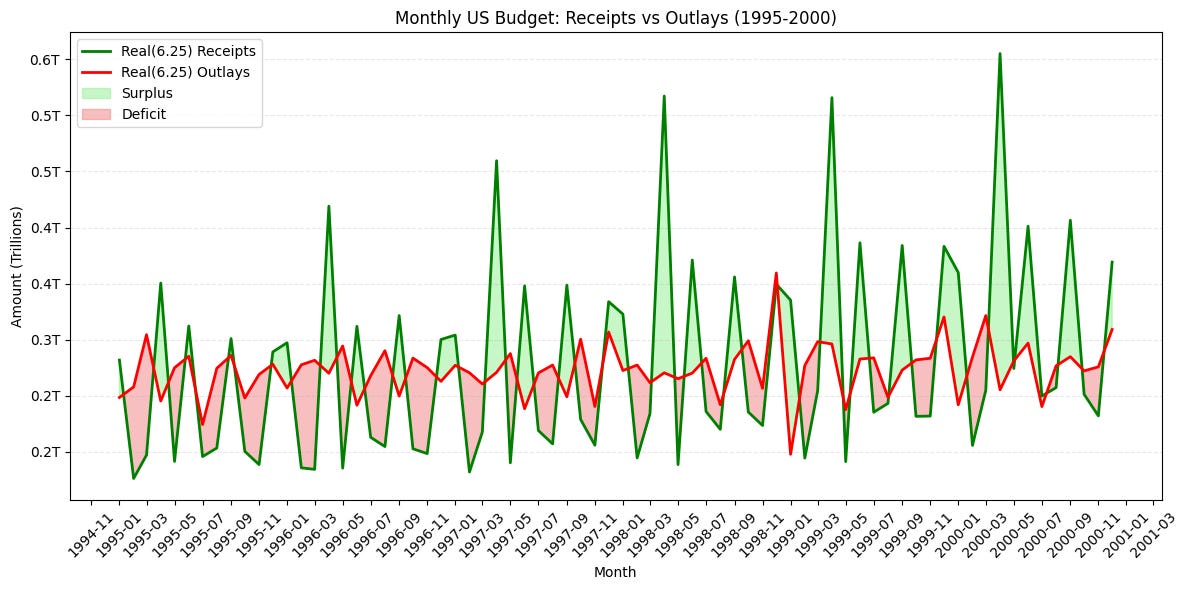
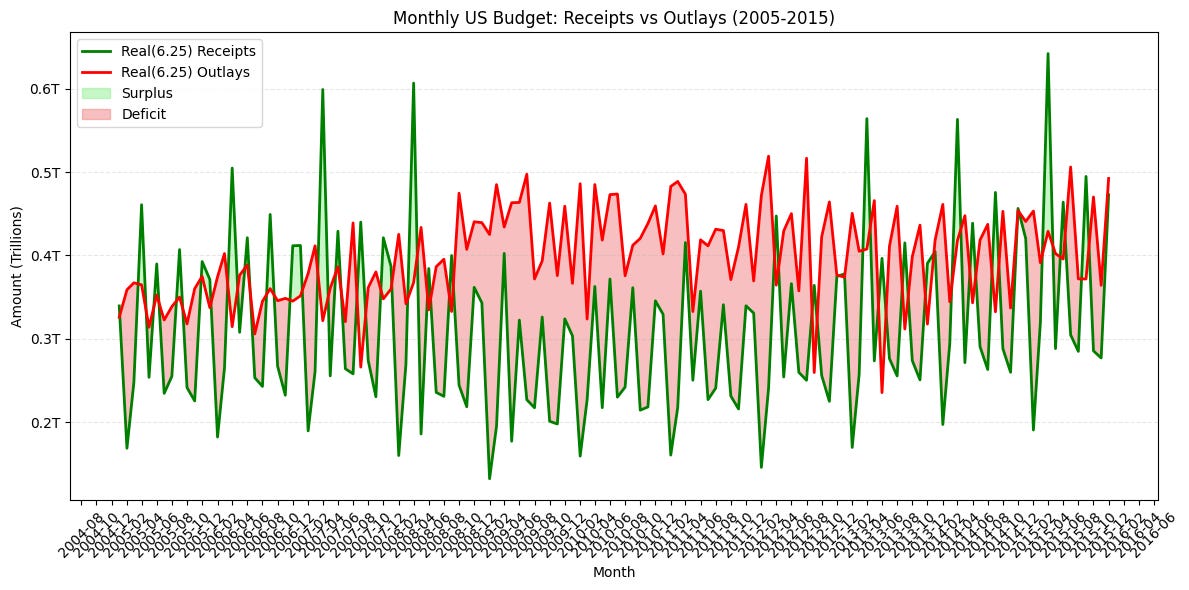
For comparison here are two other interesting periods.
First, 1995-2000
Second, 2005-2015
For $5/month or $50/year, you'll gain access to all my paywalled articles and earn a permanent spot in my heart.
Alternatively you can support me via buymeacoffee or by shopping on amazon while using my affiliate link
Frequently asked questions
What explains the pattern of US budget surpluses occurring in April, June, and September according to treasury data analysis?
The surpluses are driven by tax collection timing. April surpluses coincide with individual income tax due dates, while June and September surpluses result from quarterly estimated tax payments that businesses and self-employed individuals make. This makes a June surplus an expected seasonal phenomenon rather than an unusual occurrence.
What price index did Peter Banks use to adjust 45 years of budget data to June 2025 constant dollars?
Peter Banks used the Consumer Price Index for All Urban Consumers: All Items in U.S. City Average from FRED to deflate the nominal budget figures to June 2025 dollars. He invited readers to correct him if this was the wrong deflator choice and offered to update the analysis accordingly.
How much has real government spending increased in inflation-adjusted terms between 1980 and 2025?
According to the analysis, the US government spends approximately 3.5 times as much money in real terms in 2025 as it did in 1980. However, the author observes that this massive spending increase does not appear to produce proportionally greater government services, suggesting the growth is driven by transfer payments to populations beyond working-age adults.
Selected quotes
As you can see, we tend to have a monthly surplus mostly in April (when taxes are due) and then in June and September. I assume quarterly estimated tax payments are the main driver of this.
The author is explaining the seasonal pattern of monthly budget surpluses observed in the treasury data.
It is interesting that in real terms, our government spends ~3.5 times as much money as it did in 1980. Now, I did not live during that period, but it doesn't seem like we get 3.5× the services.
The author observes the disconnect between massive real spending growth and the lack of proportional increase in observable government services.
Related topics
US Budget Deficit Analysis · Government Spending Growth · Monthly Treasury Statements · Tax Revenue Seasonality · Inflation Adjustment Methods · Government Transfer Payments